Tags
@anthonycody, @dianeravitch, @valeriestrauss, achievement gap, children, common core, education, Educators, High Stakes Testing, poverty, SATs, teachers
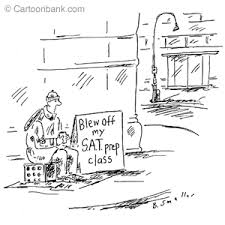
 All that CCSS “material” and TEST prep and then this?
SAT “COLLEGE READINESS” SCORES DECLINE AGAIN DEMONSTRATING FAILURE OF TEST-DRIVEN K-12 SCHOOLING
FROM DIANE RAVITCH and FairTest.
SAT scores for high school seniors dropped again this year continuing a ten-year trend, according to data released today.
SAT averages declined by 28 points since 2006 when the “No Child Left Behind” public school testing mandate went into effect.
Again, INCOME is the biggest contributor to success. For example, can you say, hire tutors?
2015 COLLEGE-BOUND SENIORS SAT SCORES BY FAMILY INCOME
| READING | MATH | WRITING | TOTAL | |
| $0 – $20,000 | 433 | 455 | 426 | 1314 |
| $20,000 – $40,000 | 466 | 479 | 454 | 1399 |
| $40,000 – $60,000 | 488 | 597 | 473 | 1458 |
| $60,000 – $80,000 | 503 | 510 | 487 | 1500 |
| $80,000 – $100,000 | 517 | 526 | 501 | 1544 |
| $100,000 – $120,000 | 528 | 539 | 514 | 1581 |
| $120,000 – $140,000 | 531 | 542 | 518 | 1591 |
| $140,000 – $160,000 | 539 | 551 | 526 | 1616 |
| $160,000 – $200,000 | 545 | 557 | 534 | 1636 |
| More than $200,000 | 570 | 587 | 563 | 1720 |
Score differences between racial groups increased, often significantly, over that period. Average SAT Scores declined since 2006 for every group except Asian-Americans.
| READING | MATH | WRITING | TOTAL | |
| ALL TEST-TAKERS | 495 (-8) | 511 (-7) | 484 (-13) | 1490 (-28) |
| Female | 493 (-9) | 496 (-6) | 490 (-12) | 1479 (-27) |
| Male | 497 (-8) | 527 (-9) | 478 (-13) | 1503 (-30) |
| Amer. Indian or Alaskan Native | 481 (-6) | 482 (-12) | 460 (-14) | 1423 (-32) |
| Asian, Asian Amer. or Pacific Islander | 525 (+15) | 598 (+20) | 531 (+19) | 1654 (+54) |
| Black or African American | 431 (-3) | 428 (-1) | 418 (-10) | 1277 (-14) |
| Mexican or Mexican American | 448 (-6) | 457 (-8) | 438 (-14) | 1343 (-28) |
| Puerto Rican | 456 (-3) | 449 (-7) | 442 (-6) | 1347 (-16) |
| Other Hispanic or Latino | 449 (-9) | 457 (-6) | 439 (-11) | 1345 (-26) |
| White | 529 (+2) | 534 (-2) | 513 (-6) | 1576 (-6) |
Calculated by FairTest from: College Board, College-Bound Seniors 2015: Total Group Profile Report and College-Bound Seniors 2006: Total Group Profile Report
